
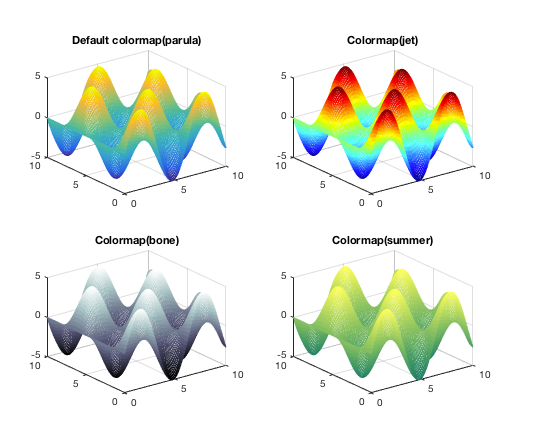
가끔 Figure에 이미지 혹은 Plot 데이터를 서로 다른 Colormap 을이용하여 분석할때 유용한 Coloramp 사용 방법이다.
z=5*sin(x).*cos(y);
ax1=subplot(2,2,1);
    mesh(x,y,z)
    colormap(ax1,parula)
    title('Default colormap(parula)')
ax2=subplot(2,2,2);
    mesh(x,y,z)
    colormap(ax2,jet)
    title('Colormap(jet)')
ax3=subplot(2,2,3);
    colormap(ax3,bone)
    mesh(x,y,z)
    title('Colormap(bone)')
ax4=subplot(2,2,4);
    colormap(ax4,summer)
    mesh(x,y,z)
    title('Colormap(summer)')
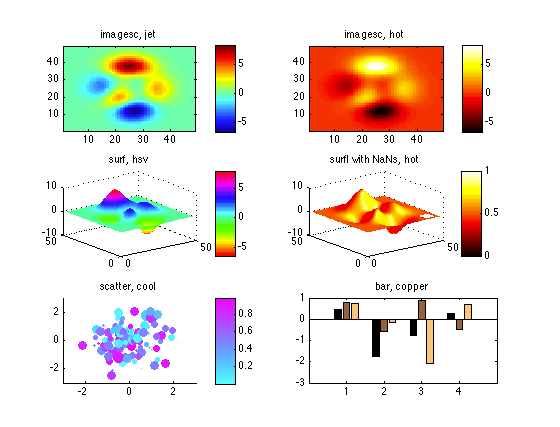
figure; set(gcf,'color',[1 1 1])

% image, colormap JET
subplot(3,2,1); imagesc(peaks); axis xy; colormap jet; title('imagesc, jet');
    freezeColors            %freeze colors of current plot
    colorbar; cbfreeze      %how to freeze a colorbar

% same image, using colormap HOT
subplot(3,2,2); imagesc(peaks); axis xy; title('imagesc, hot');
    colormap hot            %now, changing the colormap affects ONLY the current axis!
    freezeColors
    colorbar; cbfreeze

% surface
subplot(3,2,3); surf(peaks); shading interp; colormap hsv; title('surf, hsv');
    freezeColors; colorbar; cbfreeze

% lighted surface, with hole showing nan transparency is preserved after freezing
pnan = peaks; pnan(4:8,end-7:end-3) = nan; % make a small transparent patch
subplot(3,2,4); surfl(pnan); shading interp; colormap hot; title('surfl with NaNs, hot');
    freezeColors; colorbar; cbfreeze

% scatter plot and bar plot
subplot(3,2,5); scatter(randn(100,1),randn(100,1),rand(100,1)*100,rand(100,1),'filled');
    title('scatter, cool'); colormap cool; axis(3*[-1 1 -1 1]);
    freezeColors; colorbar; cbfreeze

subplot(3,2,6); bar(randn(4,3));xlim([0 5]);title('bar, copper'); colormap copper;
    freezeColors;