Image-Process [MATLAB]Generating Custom Reports with MATLAB Report Generator

[MATLAB]Generating Custom Reports with MATLAB Report Generator

GUI 또는 코드를 통해 나오는 결과들을 PDF 또는 Word파일로 문서화하여 결과를 얻을 수 있다. 코드는 다음과 같이 참고하면 되며 자세한 내용은 공식문서를 참고하면 된다.

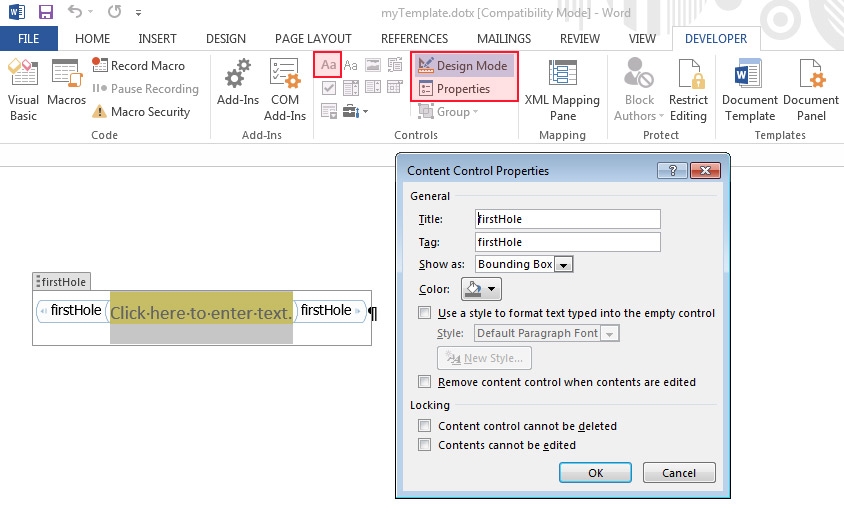
1
2
3
4
5
6
7
8
9
10
11
12
13
14
15
16
17
18
19
20
21
22
23
function fillFirstHole
 
% This function fills the hole “firstHole” in myTemplate.dotx
 
import mlreportgen.dom.*;
 
doc = Document(‘firstDocument’‘docx’‘myTemplate’);
 
holeId = moveToNextHole(doc);
 
fprintf(‘Current hole ID: %s\n’, holeId);
 
textObj = Text(‘Hello World’);
 
append(doc, textObj);
 
close(doc);
 
rptview(‘firstDocument’‘docx’);
 
end
Colored by Color Scripter
 
cs

출처 : 

https://kr.mathworks.com/company/newsletters/articles/generating-custom-reports-with-matlab-report-generator.html

Leave a Reply

이메일 주소는 공개되지 않습니다. 필수 필드는 *로 표시됩니다

Related Post

[MATLAB] Changing colors in 3D Graphs[MATLAB] Changing colors in 3D Graphs

가끔 Figure에 이미지 혹은 Plot 데이터를 서로 다른 Colormap 을이용하여 분석할때 유용한 Coloramp 사용 방법이다. z=5*sin(x).*cos(y); ax1=subplot(2,2,1); mesh(x,y,z) colormap(ax1,parula) title('Default colormap(parula)') ax2=subplot(2,2,2); mesh(x,y,z) colormap(ax2,jet) title('Colormap(jet)') ax3=subplot(2,2,3); colormap(ax3,bone) mesh(x,y,z) title('Colormap(bone)') ax4=subplot(2,2,4);